SAFE’s Energy Security Fact Pack gives readers a data-driven overview of the latest trends in energy security, including domestic and global oil production and consumption, oil market dynamics and prices, and up-to-date information on fuel efficiency and advanced fuel vehicles.
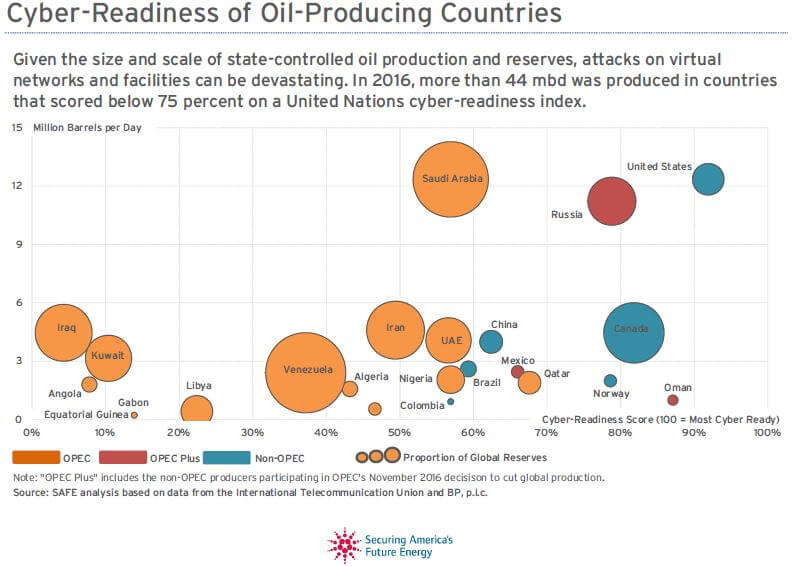
The Energy Security Fact Pack for Q2 2017 examines the rise of terrorist attacks on energy infrastructure, oil export revenues and military spending, cyber security risks in petro-states, and more.
During a time of heightened uncertainty in energy markets, SAFE’s Fact Pack includes the following insights:
U.S. crude oil and petroleum product imports grew to 10.2 mbd in Q2 2017 (+0.2 mbd, y-o-y), marking 10 consecutive quarters of y-o-y increases.
Imports from OPEC rose to 37% of America’s total crude oil and petroleum product imports (approximately 3.7 mbd) with Saudi Arabia as the leading source (1.2 mbd).
Non-OPEC supply increased for the first time after four consecutive quarters of declines (+1.3 mbd, y-o-y).
Global oil demand growth outpaced non-OPEC liquids supply for eight quarters, a reversal versus Q2 2013 and Q1 2015, and a trend last seen between Q2 2012 and Q1 2013.
Global oil demand grew 1.6 mbd y-o-y in Q2 2017 driven by growth in the U.S. and non-OECD countries (+1.3 mbd y-o-y). Demand in OECD countries grew in Q2 2017 to 46.6 mbd (+0.6 mbd y-o-y). Global oil demand has now reached approximately 98.0 mbd in Q2.
Oil price volatility averaged 42% in Q1 2017 and dropped 15 percentage points y-o-y to an average of 27% in Q2 2017. In June 2017, 30-day volatility averaged 30%, reflecting the impact of U.S. crude oil production’s sustained recovery.
S. demand for gasoline, diesel and jet fuel averaged 14.9 million barrels per day (mbd) in Q2 2017, an increase of 0.2 mbd, year-over-year (y-o-y).
Total vehicle miles traveled (VMT) increased 121 million miles y-o-y (+ 1.5%), continuing a growth trend for 13 consecutive quarters.
New light truck sales in the U.S. averaged 10.7 million units in Q2 2017, increasing by approximately 0.3 million units y-o-y. Light trucks now account for roughly 64% of light-duty vehicle sales, a 3.5 percentage point increase, y-o-y.
Over 46,000 plug-in electric vehicles were sold in Q2 (+24% y-o-y), the second-best quarter on record. Popular models included Tesla’s Model S and Model X, Toyota’s Prius, and Chevrolet’s Volt. The six best-selling vehicles accounted for approximately 63% of total sales.